
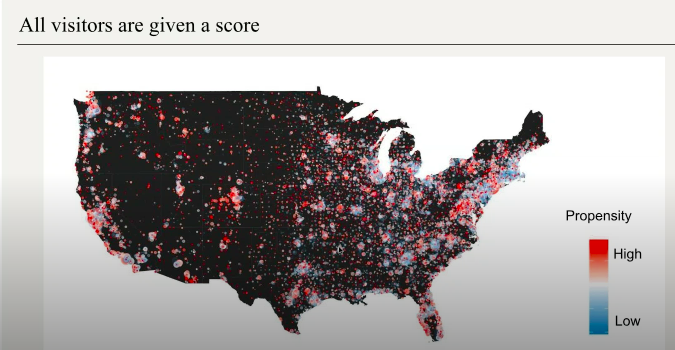
How the Wall Street Journal increased subscription revenue by 25%

The Wall Street Journal gained 25% more in revenue from subscriptions between 2017 and 2018 by personalizing readers paywall and user experience. They documented their journey in a webinar, A Year of Personalization. Below is a summary, and takeaways that apply to local newspaper companies.
Company: The Wall Street Journal
Technology: Cxense plus internal data science team
Key executives: Chris Boyd VP of product and engineering, The Wall Street Journal, (pictured above), Christian Printzell Halvorsen, CEO Cxense
Initiative: Personalization of the subscription paywall to create a customer-centric model
Challenge: A critical question for the publishing industry is finding significant new revenue models to create a sustainable business as advertising sales decline. As Cxense CEO Christian Printzell Halvorsen points out in the webinar, Google and Facebook have acquired 70% market share of advertising, the rest of media is in a fight to the death over the remaining dollars.
In local markets, the winners are quickly cannabalizing the other players, according to Borrell and Associates.
The Wall Street Journal is unique as both a national newspaper and as one that has been increasingly reliant on digital subscription revenue since the implementation of a paywall nearly twenty years ago. In fact, subscription revenue exceeded advertising revenue as early as 2016.
In the webinar, Boyd explains how that year the Wall Street Journal built its first data-driven play wall that year, which opened and closed based on the hour of the day, the day of the week, and content type, correlated to preserve the most valuable advertising impressions while optimizing customer sales.

The model worked pretty well, but it was still content-based, rather than optimised to the individual customer. The WSJ excutive team realized the future lay in creating a more personalize model, that would "learn" from the data.
In 2017, they decided to build a customer-centric model that would incorporate machine learning to dynamically optimise offers and experiences delivered to each customer.

They knew that shifting to a customer experience-based model would require adding a layer of data intelligence and the ability to served new types of offers and actions dynamically based on the data.
This model would give the company not only the best chance of predicting when someone would buy, but also what offers to serve, which engagement tools would increase impressions, and what "experience" pathways would be most likely to convert them to subscribers.

Solution: Boyd turned to Cxense to create and serve individualized offers based on data in real teim. Their “Conversion Engine” is an “out of the box turn key platform that tracks unregistered user behaviors on the site, then allows media to create and serve a variety of “experiences” such as related story content, newsletters, registration and paywall offers. All this can be placed in variety of positions on the site, and with the ability to test those experiences. In short, a smarter paywall, that gets smarter all the teim.
The Cxense platform already incorporates “machine learning” so that it becomes more intelligent as the data accumulates. Christian Printzell Halvorsen, CEO of Cxense claims that the out-of-the-box model delivers additional revenues to small publishers in as little as a month. See oiur case study on the personalization model at Sandusky newspaeprs here.
But the Wall Street Journal had several data scientists on staff willing to create an even powerful data modeling tool, and feed the data back into the Cxense model by means of an API.
The three WSJ data scientists went to work, building a tool that extracts data on unregistered users from the website and merges it with other WSJ-owned data to create a full set of data “signals” such as zip code and known income levels, in addition to number of visits, types and number of articles, type of device, and one of the key signals, most recent visit.
A total of 65 different data points were then matched with purchasing behavior to score the “propensity to buy” for each user.
Every non-subscriber is scored simply as HOT, WARM or COLD based on the data sets.

The model launched in August 2017. Then, “we had to give the model some time to learn,” Boyd said.
After several months, the team checked the propensity scores against the actual results and realised they had scored a home run: The model was 90% accurate.

A year later, Boyd says, the model has gained in intelligence. Shown on a map, the most likely buyers are concentrated in high-density urban areas.
Using the data
The next step was to turn “propensity to buy” into relationship strategies and sales, in short, which offers to serve to which users.
The marketers could create offers, guest passes, newsletter sign-ups and other engagement tools within the Cxense platform, and decided to build and test a decision tree for each type of user.
The same data about a user can be used, Boyd said, for promotional placements for subscriptions, for ads on the site, newsletter offers, and even the location of the placement of offers on the website.
Below is a look at the scoring tree, starting with key signals (Reads Opinion, Higher Education, High area income) and moving up in propensity (5+ article view, mobile app use). Each user can be sent a closeable article or guest pass, newsletter, or a hard paywall.

“We use the information in multiple ways,” Boyd said, at this step, to “operationalize the scores” are used to deploy a variety of offers. The final phase is to look at the analytics to see what is working.

Included in the “experiences” tests are newsletter sign-ups that register the anonymous non-subscribers. With 30 different newsletters, the data shows which user will see which newsletter offer, and if a second newsletter offer will show up as the next experience, or, rather, for a buyer with the highest propensity (based on income, location, number of views, recency and other key data factors) is shown a hard paywall.

The WSJ also uses Cxense data to test the type and placement of subscription offers on each device.

Finally, the WSJ uses data to select the related story recommendations - a task that had been previously left to the editors.
They quickly found a high response f4rom “Pop-tarts,” or recommended stories that appear 50% through an article rather than at the end, as not all users finish the stories. This approach helped the WSJ create “positive experiences” with the WSJ and maximise ad impressions and reduce churn. In fact, per user pages views quadrupled.

At every phase, the team conducted A/B testing for placement of ads and promotions.

Results
The results have been nothing short of dramatic. For a company that already had a mature subscription revenue stream, the number of subscriptions grew by 25%. And there were other positive strategic impacts:
-
Registered member grew by 400%
-
Readers were twice as likely to engage with article recommendations
-
They had 242% more page views and stayed 1.5 times longer each session
Next steps
The next phase of the program will look at how data factors influence churn rates and follow the entire lifecycle of the customer.
Mapping actions like subscribing to an app and how much of a reduction will occur in the churn risk profile.

Questions from the audience after the webinar included whether or not you need a data science team. The answer is no, you can use the Cxense platform´s algorithms “out of the box” to track the most important data signals and create experiences.
One person asked how they married the need for excellent journalism with a data-driven environment. Boyd said leadership teams that included the journalists, ad sales, and that he made subsets of statistics available to the journalists. He did not feel there was a trade-off between good journalism and data testing, but rather that the information could be used to show the value of each story to the reader.
One person asked how big the data set needs to be since the WSJ writes 300 articles per day. The answer is that anyone can use much smaller data sets to test the model.
What happens to a readers score when they do not act as predicted?
One of the key signals is the recency of the last visit. If someone stops visiting, the propensity is dynamically lowered, and they get a new experience. They can waver back from cold to hot, “but we don't see people crossing boundaries backward.”
What about purchasing third-party data? The WSJ said their data was sufficient, since they already had data sets from using Cxense for advertising in the past.
How much time to get enough data from personalization to pay off? In the case of the WSJ, they had already used Cxense for some advertising on the site and thus had two years of data on hand. While results vary from publisher to publisher, Christian said it typically takes a month or two to see revenues from the system.
To study up on personalization here is the full webinar, A Year of Personalization, a case study on Sandusky Newspapers and another great way to start up personalization by signing up ad blcok users.


