
What goes into a great "post campaign" recap?
It's easier said than done, but we've boiled down a few key rules
The sale's been made. The campaign has run. But is the customer happy? And will they buy again?
95% of training is spent on how to get the sale. But as multi-platform campaigns evolve, so has post campaign reporting, or the "recap."
We interviewed number of sales managers and trainers for this report, on how to create a campaign recap that engages the client in the next sale (including Leslie Laredo of Laredo Group, whose essay on how to do a great recap is attached).
First, please note that coming up with a great recap relies largely on putting a solid process in place. Here are our recommendations about process:
*Start with a template.
*Begin to fill-in the template when the order is turned in - not after the campaign.
*Sign up for an automated universal dashboard that covers variety of products, such as ClickFuel and Taponix. The cost of these services is now reasonable and greatly increases efficiencies.
*If data is coming from different departments (the sales person, the trafficer of the universal dashboard, the ad department to post cvisuals of ads to the recap, an analyst to make optimization recommentations, etc) post the template to a shared document system (Google docs will work in a pinch) so that each department is reponsible for filling in its piece.
*The top exec over all the departments, or the sales manager manages needs to own the process intially until it becomes habitual within the organization. Most of the time, an admin or assist will not have enough clout to get all the departments cooperating.
* Review and use reports for training and benchmarking. As important as taking the recap to the client, is using the information to train the team. They will go to market with greater confidence and better advice.
*Client recaps should appear as digitally savvy as sales presentations. We especially like Flipsnack to create a flip the page (PDF) presentation for big accounts, and have at least one tablet for the department for those key "go back to" calls.
So what goes into the recap itself? Here's a basic outline of four key components, followed by a mock-up sample, and some real world examples:
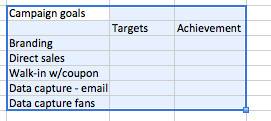
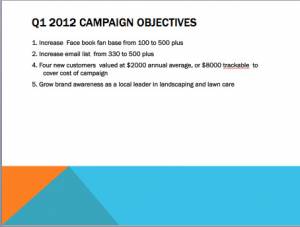
A. Restate campaign goals
1. State the client's objective and secondary objectives
2. Outline the targets, and how they will be measured
3. Include ROI assumptions
Note: Include this information on the recap template when the order is turned in - that is at the beginning of the sale, then post to the shared server or Google docs.
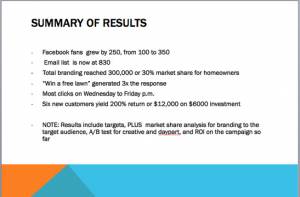
B. Summarize Results
1. List Campaign results in order of importance.
Note: This is not the dashboard, but the reps summary of key points from the data.
C. Screenshots or live analytics
1. Charts or dashboards showing analytics (such as ClickFuel's or a simple DoubleClick print out)
2. Visuals of digital ads, screenshots of Facebook etc.
3. Scores or ratings against averages, optional
Note: Many media sales teams flip B and C, however, keep in mind that a dashboard is not a summary and will not match the client's objective. Having a summary of key results in order of importance to the client is a key part of the recap.
D. Visuals of campaign elements
This helps the client to "see" what they got, and is especially useful later for the sales department to learn what kinds of ads and creative gets the best results. It may, in fact, be the only opportunity to systematically capture the results with the creative, to train against at a later date.
e. Recommendations
1. Optimization recommendations for next campaign
2. Conversion strategies
3. Seasonal issues
4. New services
Sounds simple? Let's take these steps one at a time and then look at some real world examples.
A. Restate the campaign goals
1. Objectives and secondary objectives
Identifying the reason to advertise is what reps do best in the selling process, but also the single largest missing piece in most post-campaign recaps. Typically, the "recap" starts with a set of analytics or a dashboard, and if there are multiple products, a stack of reports.
Best practice: Initiate the recap when the proposal is made or sale turned in, with objectives are explicitly stated from the get go. This is why we recommend that to force the practice into the system, every contract should be accompanied by the recap document with objectives and how to measure them built in.
Most reps understand how to state the client's objective; ultimately, most businesses want to increase sales. In the evolving digital economy, objectives need to be specific and measurable.
We recommend identifying measurable contacts, such as email forms, fans, phone calls, coupons activated, etc. and calling these "leads." Using the word "leads" instead of "data" implies that these are valuable contacts to be sold, rather than just a set of information.
Sales managers can add other things such as site visits, and an "other" category. However, teh most important concept is to help reps start to identify what the merchant really wants: Are they content to reach customers in the research phase, to drive them to look at the web site for more information? Are they interested in building a database of potential customers to whom they can remarket?
Or do they want customers to take an immediate and specific action, such as buy online, call for an appointment, redeem a coupon, send an email or come into the location?
2. Outline targets and how they will be measured
Requiring a measurable target not only makes the campaign recap much smoother, but also completes the agreement with the customer about they find important.
Sales reps object that requiring measurable results will cost them revenue, is impossible, or that the customer is just not interested. However, once you get to any significant dollar amount for advertising, ($6000 a year is about the cut-off) businesses increasingly want to know what they will get. Yes you can include, a n/a category, however, sales managers will know which reps are turning in the n/a's.
- How to measure branding
Branding is hard to measure, and out-of-favor now with small businesses focusing on the end of the sales funnel, but still important, even it if is a secondary objective. An easy way to recap this is to simply measure the size of the audience reached by the ad.
However, increasingly businesses want targetted audiences; for example, The Pampered Pooch may want to reach only dog-owners.
So once the audience is identified an easy way to measure is simply, the number and percentage of the audience reached, and if applicable how many times, using Media Audit, plus behavioral targetting or other market research.
Another measurement of brand awareness is how many people visited the client's web site, in the "research stage." One statistic that reps can use to extrapolate the real number of web site visits for online campaigns, is this CTR x 4, that is 80% of web site traffic from a banner ad searched, rather than clicked (use this super sales statistic on why clicks are worth 4x more). For broadcast and print, be sure to get a starting number for web site traffic before the campaign begins and include "increase in traffic to the site" as a measurable result.
Civic Science polling is another way to measure awareness before and after the campaign (see our review of this free tool here). Once the poll is installed on your web site, (not only free, but they pay media for the questions they use in the poll) , you can use it to determine lists of "best known" companies. This is measured by % of the audience that is aware of the company before and after the campaign.
- Measuring leads
As noted earlier, we are recommending that you train advertisers to think of all data collected on potential customers as leads. They will put a greater value on these results if they are planning to "sell the lead" rather than collect information, or "data."
Email, fans and sms. Many small businesses today want to build lists of interested customers that they can reach directly and for "free." That means, building their own email lists, fan bases, or SMS opt-ins (leads!).
The good news is that these are explicitly quantified, and advertisers are typically are willing to spend more to build these "free" marketing lists of leads.
Note starting points in the initial recap document turned in at the time of the sale. Customers often forget where they started before they ran the campaign, and need to be reassured how much they have achieved. So collect starting numbers of fans, emails, etc.
Best practice: Be bold in setting long term growth targets. Go for annual or three year targets that will support several campaigns with incremental bumps. Use the recaps outlined here to optimize the next campaign and identify the annual ROI.
Phone calls. All local media today should deploy a phone-call tracking service for customers who rely on calls as leads. Our pick is TruMeasure because it is less expensive than others we looked at and also has "post-click" reporting so that you can see where customer when after they clicked on a banner ad, helping address other client issues.
Especially interested in call-in businesses are doctors, insurance, lawyers, beauty salons and schools.
Also some big advertisers in the home services area rely on appointments and have known conversion rates, while plastic surgeons for example, may want you to prove the call was a customer. In that event, you can match the appointment schedule, the length of the call, and usually wind up improving the front desk's service by showing "what happens" when a lead calls in.
Coupons Increasingly most local media have some kind of trackable redemptable coupon, either on a directory, mobile device, or coupons site, or even deal platform. Redeemed coupons are not exactly the same as sales, (businesses may actually not want all of their group deals redeemed in person if they do not have a customer loyalty program attached) but as a point of agreement, these work just fine.
- Direct sales. If a local advertiser has an online store, it's easy to work out the ROI for advertising. Trumeasure can track the customer from the website to the online sale.
Rule of thumb: Card filled out "in store" are absolutely useless in tracking, don't do it. Another source of tracking failure is a too small offer - such as a "free glass of champagne" for buying a ticket to a theater event. By the time the ticket is purchased, the customer has forgotten the champaigne offer. Finally, if the promotions is also created in the store, make sure that you get credit for the whole campaign, rather than competing with in store promotions - there is really no way to tell, for example, if someone came in for the happy hour from the ad, or saw it on the table top tent.
CTR's are commonly used because they are always available; however, its better to utilize site visits, or to compare CTR with averages to show that the "campaign did well." Rarely, however, does a client ask for, say, a CTR of 1% as an objective. What they want is the lead, site traffic etc.
3. Include ROI assumptions. What is the annual and life time value of a new customer? How many of the leads are expected to convert to customers? Use the advertiser's own estimates to calculate the value of the targets they have set, whether in data or in new customers. This allows you to ROI the campaign during the recap.
If you decided to track leads, here's an example of tracking ROI against the lead:
# Lead x estimated conversion (use client's typical experience for the conversion), x average order x average annual visits. You can even muliply this by a number of years (again estimated by the client) to get the lifetime value of the new business you are creating. Six leads a week (phone calls) for a hair salon may have an annual value of $600 each, so a $300 a week campaign would yield an annulized ROI of $3600 -$300. Not too shabby. Include these numbers.
So what does this look like? Here are the first two pages of a sample recap on Power Point (it is also available in an attachment at the bottom of this report):
B. Summarize the results in order of importance
Typcially, the analytics (DoubleClick reports plus additional reports) are brought to the client in a stack that the client may not understand how to read. Or, the best recaps we've seen go show each part of the campaign separately with results.
Our recommendation (from Laredo Group) is to summarize the key results in the order of importance to the client, then include analytics afterwords. This way the client gets what they need first, and then if they want to review the analytics, they are there and will lead to a conversation about recommendations.
Results typically include leads (forms and phone calls), web site traffic, new customers (if they can be tracked), and of course, branding. However, you may also want to include results from the analytics of a/b testing, or which days or parts of the campaign were most effective.
Finally, be sure to estimate annual business from customers gained in the campaign (based on the client's own information given in the sales process, regarding the worth of a lead, a customer, etc.). This is a jumping off point for recommendations to the client on converting leads to customers, or setting up customer loyalty programs, etc.
c. Analytics
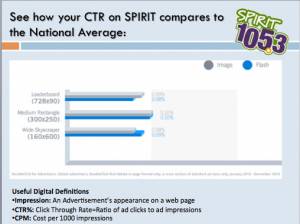
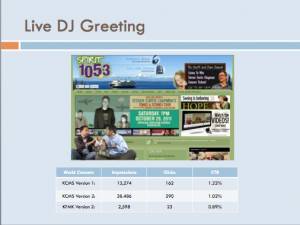
For a simple banner ad campaign, this is the slide where you put your DoubleClick scores. Another option is to create a chart that shows the CTR versus the average of .1% to show how much better the campaigns did than average. Here is a sample slide from a radio program recap report, along with a comparison of CTR versus average (this is from Channah Hanberg, digital sales at Crista Broadcasting):
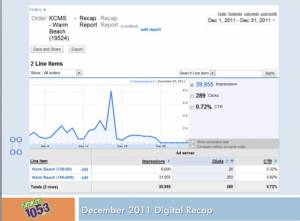
This is where it gets tricky; with mulitple platforms, is there a way to show a universal dashboard? Or is it neccesary to cut and paste each one? We recommend partnering with a platform that pulls mulitple data sets into a single dashboard, such as ClickFuel or Taponix. Another way is to create a home-made chart of "leads"
Otherwise, sales reps will need to screenshot each applicable dashboard or post data points on the visuals.
If you use a company like ClickFuel, this information is already precreated:
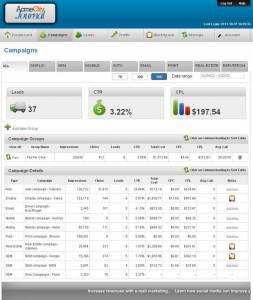
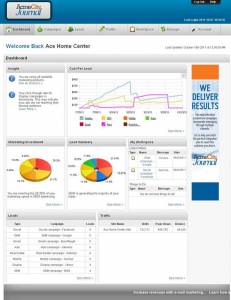
Notice that ClickFuel caculates "leads" which are typically email capture and phone calls, that are tracked by the email service and the call-tracking service, but pulled into one dashboard. There is more of an emphasis here of cost-per-lead, so make sure that your results summary has included the revenue per lead and estimated ROI.
Note also that dashboards contain other useful data - targeting by time of day and day of week, a/b testing of creative, relative CPL, and which media has been most effective. This information is especially helpful in the next and final step of a great campaign recap, the recommendations.
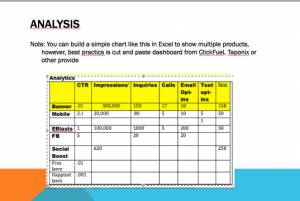
What if you don' t have a partnership like ClickFuel, but do want show analytics from multiple products? However, you can also combine results on an excel spread sheet to track key Before and After leads from the statistics. When the recap document is placed in the shared file, information from different departments can be easily updated. Here's a home-made version:
d. Visuals
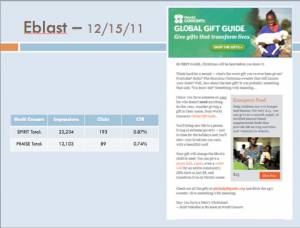
The document should include at least one page to show the visual elements - production can post these to the document on the shared server. Even better, place the numerical scores for the visuals (in phone calls, forms, site visits, etc.) on the visuals. This is something that top sales reps in broadcast are already doing; here's a sample from Channah Hanberg, Digital Specialist at Cristabroadcasting.com radio group:
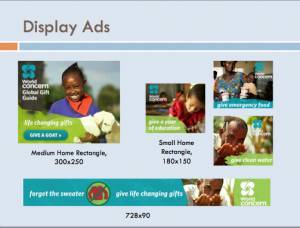
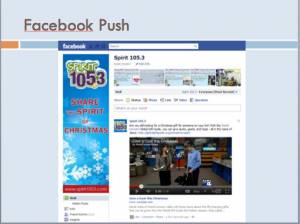
For a big advertisers, showing all the elements visually can be as important as the dashboard.
e. Recommendations
The recommendations step is where digital specialists can really help out. Afterall, the recap is the best opportunity to pitch the next campaign. So what should go into the recommendations part of the recap?
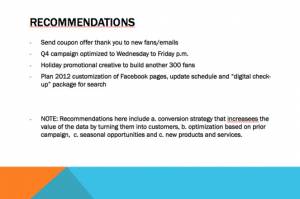
1. Optimization recommendations. If there are a/b tests - or just more or less successful pieces of the campaign, recommend optimizing the next investment by puttting more of the dollars in what worked best. For example, if mobile CTR's far surpassed those of online banner ads, recommend that the next campaign go mobile only. Similarily if one creative worked better than the other, a day part, day of the week, etc. the optimized campaign can take advantage of what was learned.
2. Conversion strategies. The more excited the client is about converting their database of leads and potential customers into real customers... the more interested they will be increasing their next advertising campaign. So, include a recommendation for sending a coupon or other offer out to help convert those new acquisitions to customers.
3. Seasonal opportunities. Many local businesses ebb and flow with the seasons, or may be interested in seasonal opportunities such as sponsorships of events or sports. Combining knowledge of "what worked" with new opportunities is a great way to acquire new dollars.
4. New services. A banner advertiser who has had some success may be interested in other service the local media has to offer.
Here's a mock-up of the final set of recommendations from our theoretical account:
Conclusion
If this report is way ahead of where the sales organization is today, don't worry. The best recaps we saw were in broadcast media, did not always recap the objectives. In the crawl, walk, run model, we recommend setting up this five step recap model, even if the first results are web site visits and a few phone call reports. To review:
a. Objectives with targets entered on a recap at the time of sale
b. Results
c. Analytics
d. Visual of elements
e. Recommendations
If you set this process up, your organization will have great data to share and train against at sales meetings, even if it's only CTR's in the beginning. Also, sales managers will be able to "see" which reps actually obtained real objectives with a measureable targets from their customers, and which ones got only an n/a. Finally, your team will be better prepared to offer additional services as it grows its agency model.
So how large does an account have to be before this is "worth" a recap? We think an account that is marketing-oriented with a potential advertising spend of more than $6000 a year is about the cut-off. Keep in mind that once the system is in place, it can be scaled up or down depending on the importance of the client, but you will still have data on results of every campaign.
Many thanks to all who contributed to this report, and especially Leslie Laredo from Laredo Group whose essay on the topic is below. If you have a great recap system at your company, please let us know at LocalMediaInsider@gmail.com
Keywords
sales, best practice, multi-platform, laredo group, template, leads, chart


